
Why I Built Another Profiling Library
And What I Learnt Along the Way

Every time I start a new side project, I promise myself I won’t reinvent the wheel. Yet here I am, shipping Profilis, a modern profiling library for Python web apps.
Now, before you roll your eyes and say, “But don’t we already have cProfile, PyInstrument, py-spy …?” You’re absolutely right. We do. They’re great tools, powerful in their own right. But if you’ve ever tried plugging them into a real world project that isn’t a toy script, you probably know the friction:
Some are CLI first, harder to integrate in app.
Some add a bit too much overhead.
Some make sense only if you’re profiling one off runs, not continuous monitoring.
And almost all of them feel heavy when all you want is a quick, no nonsense snapshot of what’s eating up time.
That itch, that gap between too simple and too heavyweight, is why I built Profilis.
What I Learnt While Building It
I’ll be honest: building Profilis wasn’t about replacing the giants. It was about learning by doing. And it taught me a few things worth sharing:
Simplicity > Magic
Developers don’t want black boxes. We want to know exactly what’s being measured and how. Profilis is intentionally minimal: a decorator, a context manager, a StatsStore. No hidden side effects.
APIs Should Feel Native
I obsessed over making usage Pythonic. A single import, a single line of code, and you’re profiling. If I had to look up docs every time, I failed.
from profilis.decorators.profile import profile_function

@profile_function(emitter)
def expensive_calculation(n: int) -> int:
    """This function will be automatically profiled."""
    result = sum(i * i for i in range(n))
    return result
Visibility Matters
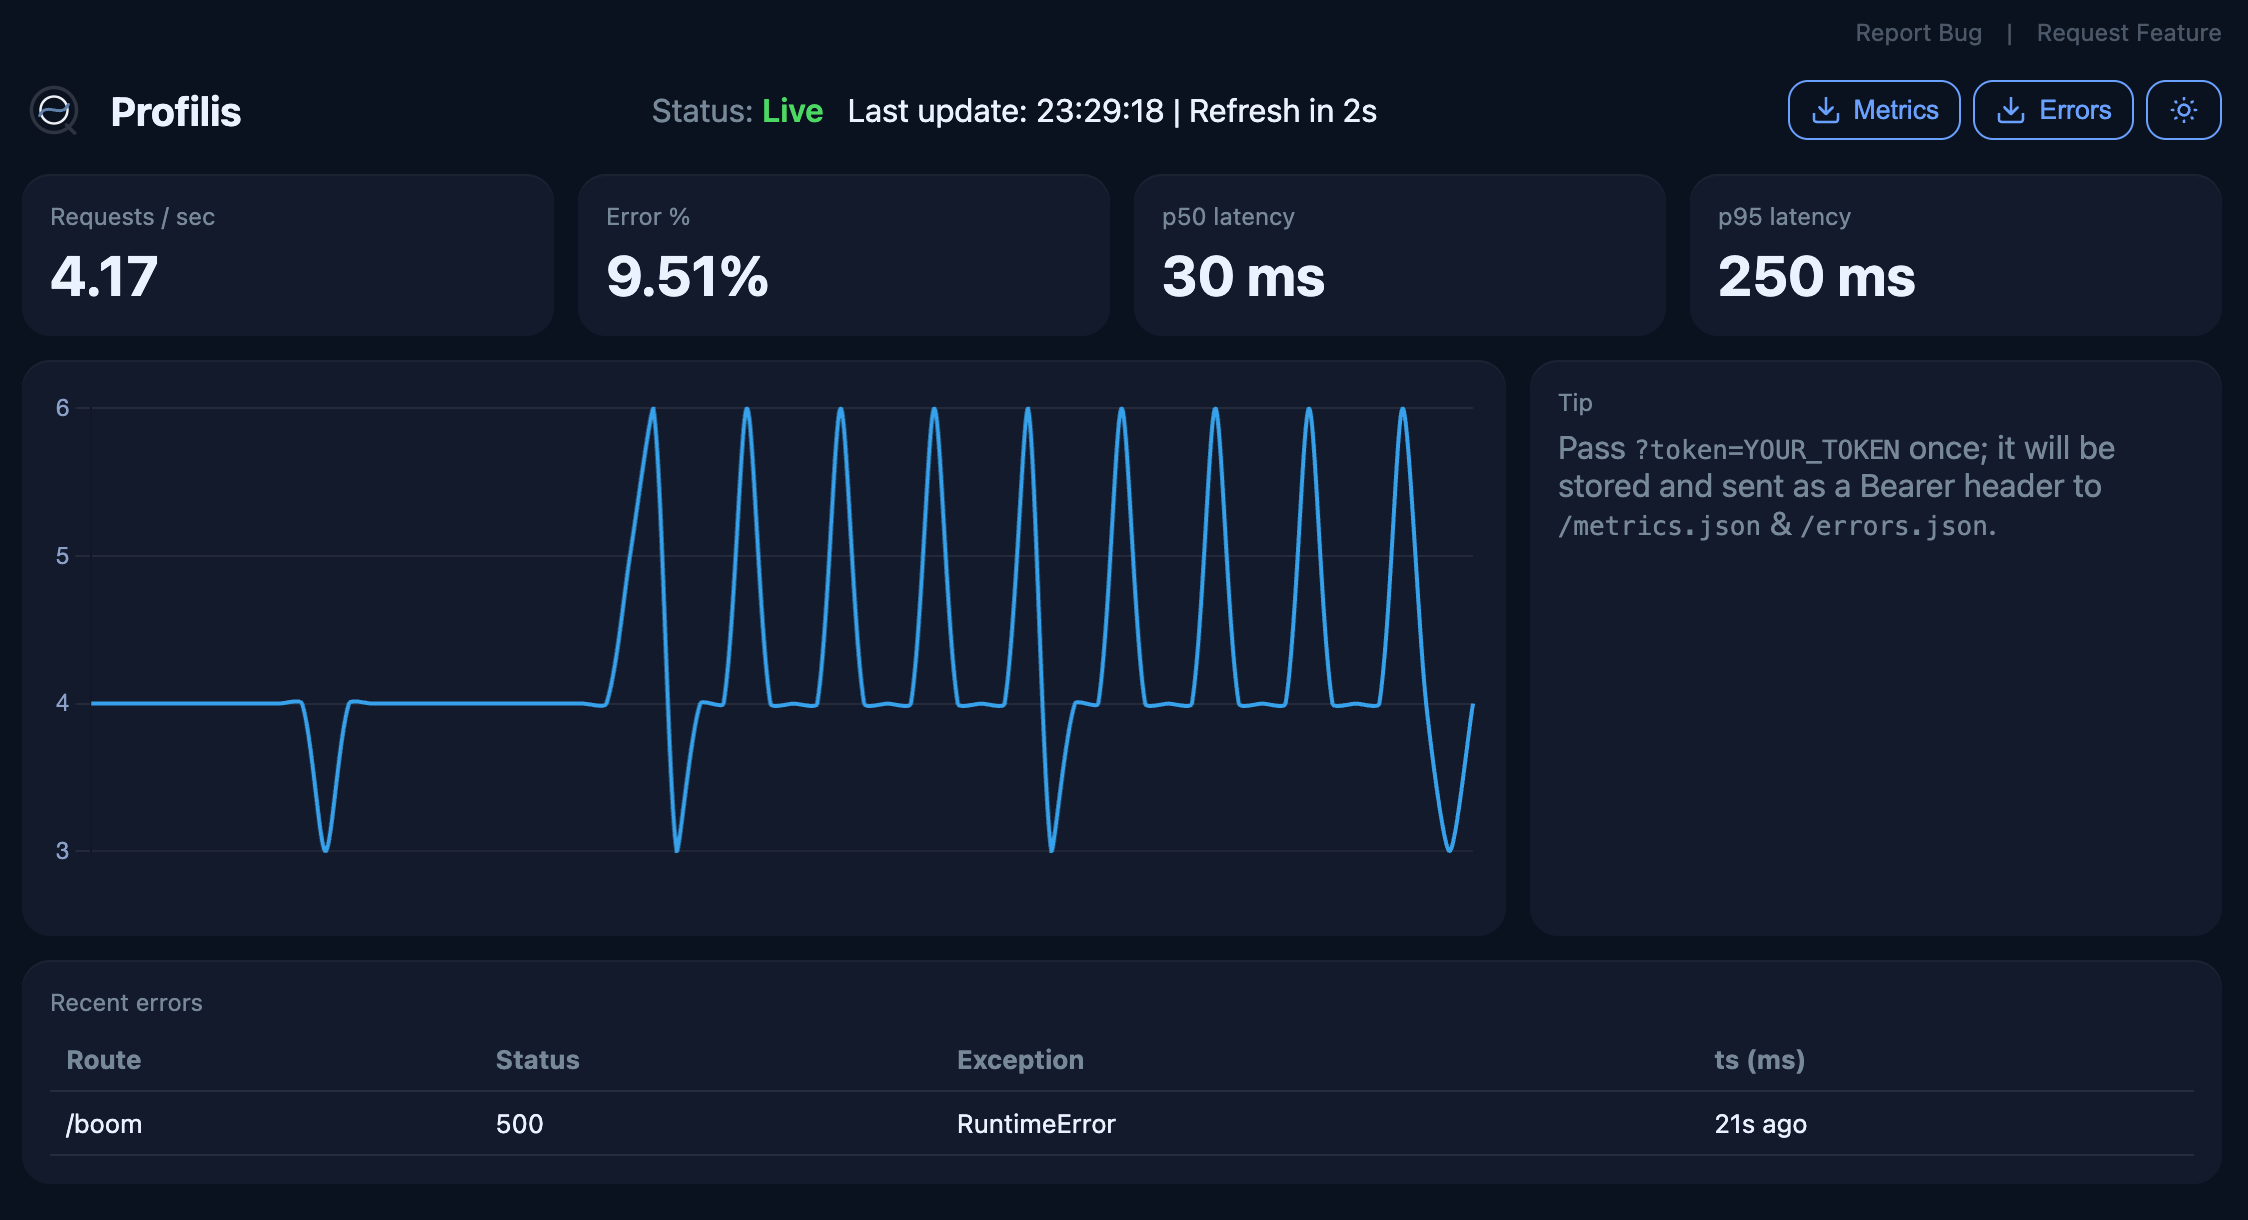
Profiling isn’t useful if it stays in logs. That’s why Profilis ships with a tiny JSON + HTML dashboard baked into Flask. You get a view of KPIs and bottlenecks at a glance right in your browser.Constraints Are a Gift
By forcing myself to ship a 0.1.0 MVP, I avoided rabbit holes. No over engineering. Just enough to prove value.
Why It Helps the Dev Community
Profilis isn’t here to “win” against cProfile or py-spy. It’s here to serve a specific slice of developers:
Builders who want quick performance insights inside their app.
Teams who prefer lightweight instrumentation without extra dependencies.
Learners who want to peek under the hood of how profilers work.
By keeping it simple and pluggable, my hope is that Profilis lowers the barrier to actually caring about performance. Because let’s be real, most of us only reach for profilers when things are already on fire. What if instead, it was easy enough to profile continuously, like logging?
What’s Next
This is just the start. v0.1.0 ships with the basics including decorators, context managers, stats collection, and a dashboard. The roadmap includes:
Richer visualizations and charts
More granular insights (per function, per route, DB calls)
Including support for popular databases
Integrations with modern monitoring stacks
And of course, community feedback will shape where it goes.
Closing Thoughts
I didn’t build Profilis to compete. I built it to learn, to scratch an itch, and hopefully to make performance profiling a little less scary for the next developer who just wants to know what’s slow.
If that sounds like you, give it a spin:
pip install profilisWould love to hear your thoughts, feedback, and ideas.
