
Rethinking Profilis and Observability
Design decisions beyond the first major release

It’s been a while since I wrote a blog.
The last few months have mostly been spent building Profilis, a lightweight observability tool for Python services. v1.0.0 is now out, and it proved a few important ideas:
Event creation should be extremely cheap.
Observability should never block the request path.
Instrumentation should remain framework agnostic.
In other words, observability should behave like infrastructure, not an experiment.
But shipping the first version also surfaced new questions.
The architecture works, but several parts of the system still feel… fluid:
the event schema is flexible but not formally defined
the collector works well in a single process but multiworker deployments need clearer guidance
exporters are powerful, but pipelines are implicit
So before jumping into features, I started thinking about Profilis v2 in a slightly different way.
Instead of designing features, I started asking a sequence of architectural questions.
The Current Architecture
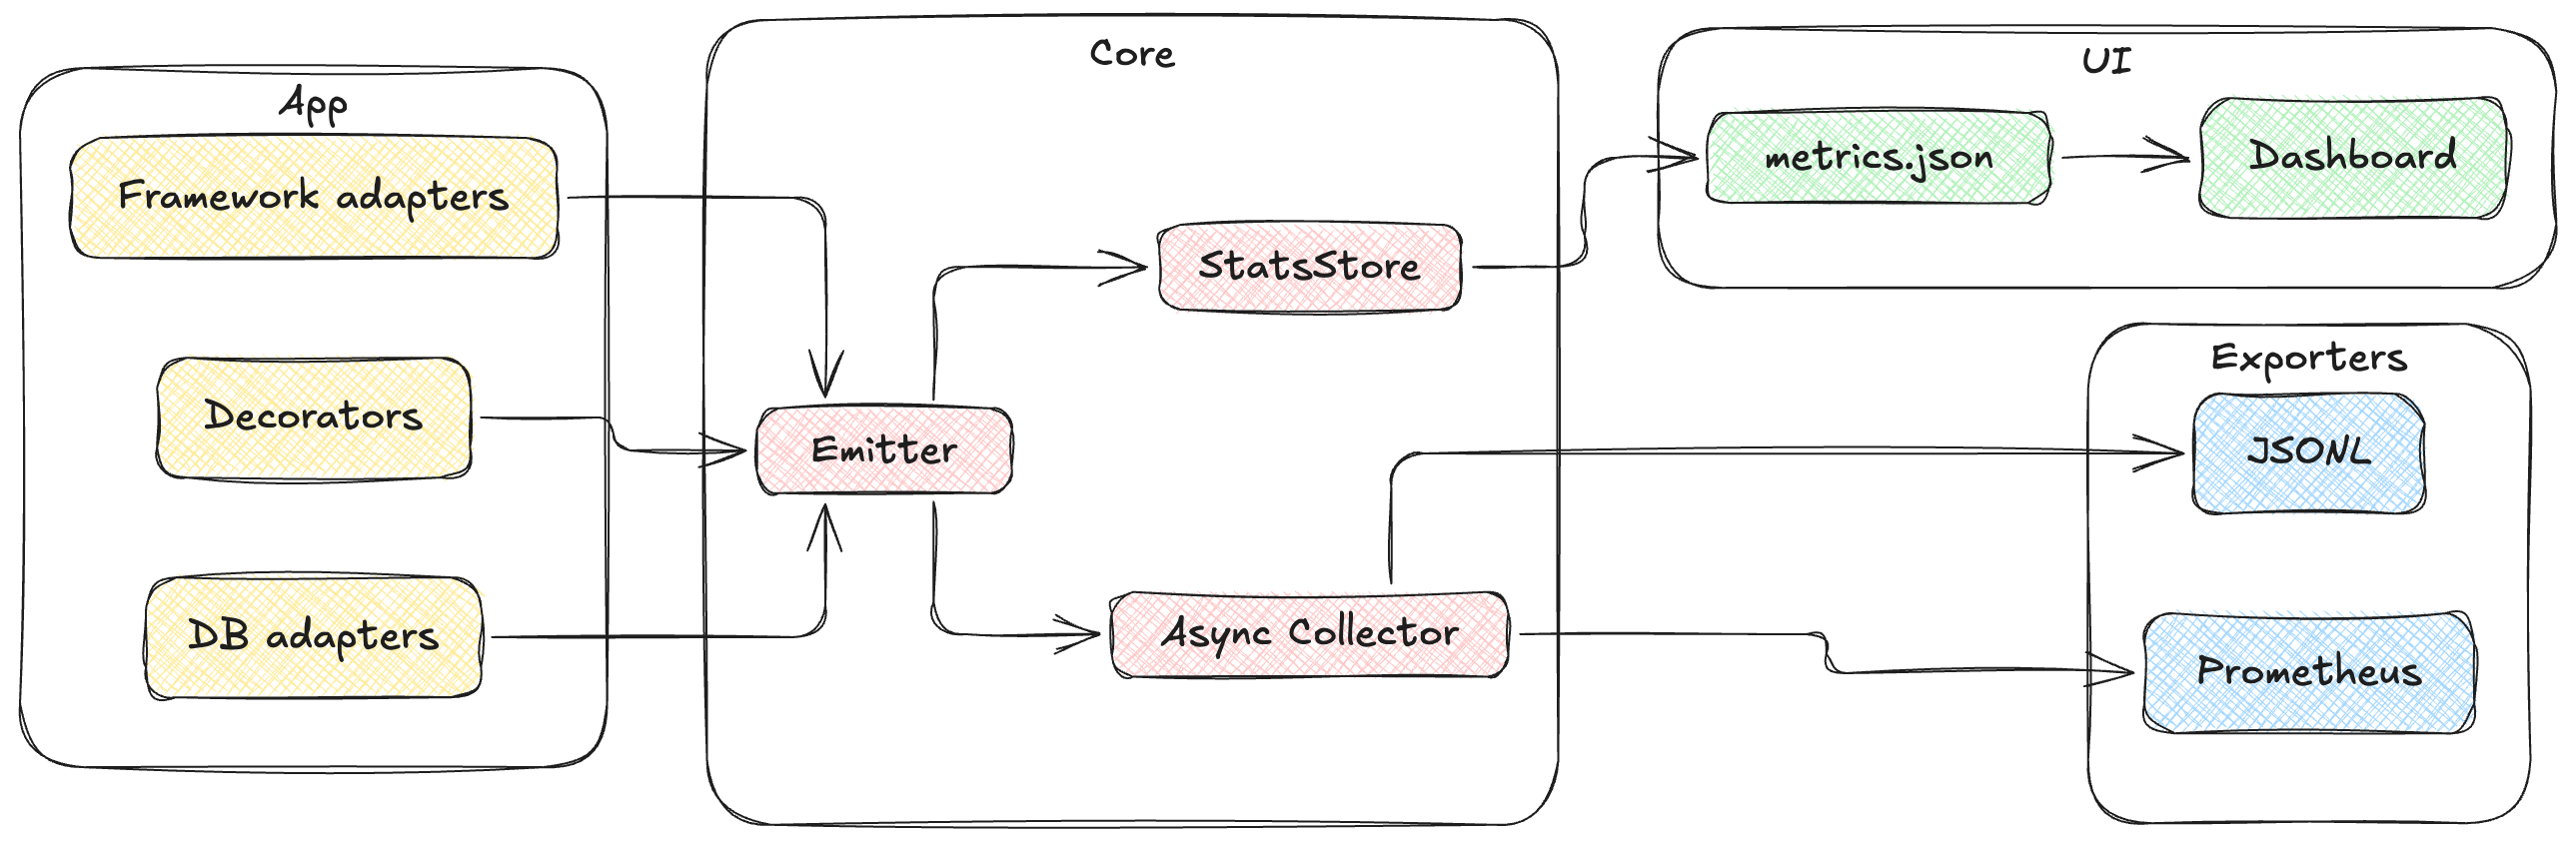
At its core, Profilis is a small telemetry pipeline.
Instrumentation produces events.
Those events are buffered asynchronously.
Then exporters consume batches.
The design goal is simple:
Keep the hot path extremely cheap.
Instrumentation emits small dictionary events, which the collector batches and forwards to exporters on a background thread.
This keeps observability from interfering with request latency.
But the current version also left several design questions open.
Should Profilis Have a Stable Event Schema?
Right now events are simple dictionaries.
Example:
{
  “kind”: “HTTP”,
  “method”: “GET”,
  “route”: “/orders”,
  “dur_ns”: 148200,
  “status”: 200
}
This flexibility made development easy. Adapters could evolve quickly without worrying about strict schemas.
But over time this becomes risky.
Exporters need predictable fields.
Event evolution becomes implicit.
Backward compatibility becomes unclear.
So the first question is straightforward:
Should events have a versioned schema?
And I can think of two possible scenarios here
1. Keep Flexible Dict Events
Pros:
adapters remain simple
schema evolution stays flexible
Cons:
exporters must tolerate schema drift
compatibility guarantees remain unclear
2. Introduce a Versioned Schema
Events could include explicit metadata:
{
  “schema_version”: “2.0”,
  “profilis_version”: “2.x”,
  ...
}
This allows exporters and processors to rely on a stable contract.
The likely direction for v2 is a versioned schema, while still keeping plain dictionaries on the wire for performance.
Internally, typed contracts (TypedDict) can enforce structure without slowing down emission.
Should the Collector Become Async?
Modern Python frameworks are increasingly async first.
That raises an obvious question.
Should AsyncCollector actually become an asyncio task?
A hypothetical async collector might look like this:
async def collector():
    while True:
        batch = await queue.get()
        await exporter.send(batch)
At first glance this feels natural.
But there’s a subtle problem.
Profilis deliberately keeps the telemetry process separate from the application runtime.
If the collector depends on the application event loop:
event loop congestion could affect telemetry
exporters could interfere with request scheduling
instrumentation behavior becomes framework dependent
The current implementation avoids this entirely by using a dedicated worker thread.
So the design question becomes:
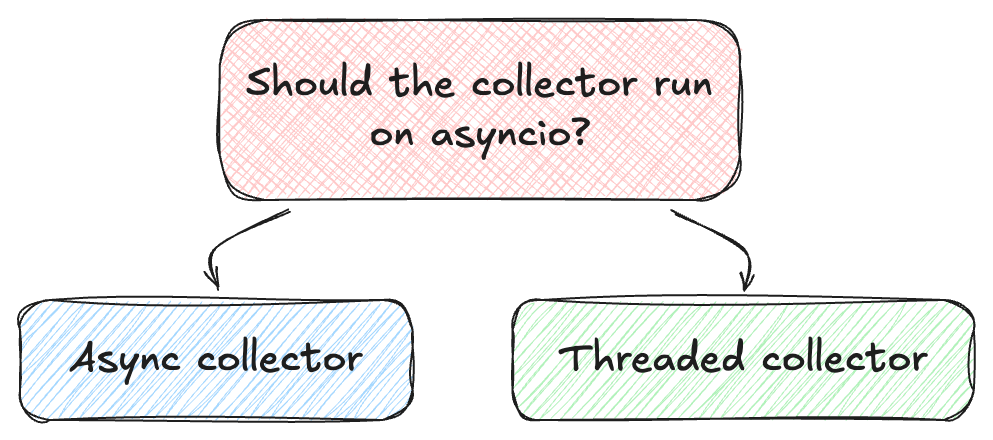
For now, the threaded collector remains the safer option.
It keeps the observability pipeline independent of whether the application is:
synchronous
asynchronous
or a hybrid stack.
How Should Profilis Work Across Workers?
Single process applications are easy.
But production deployments often look like this:
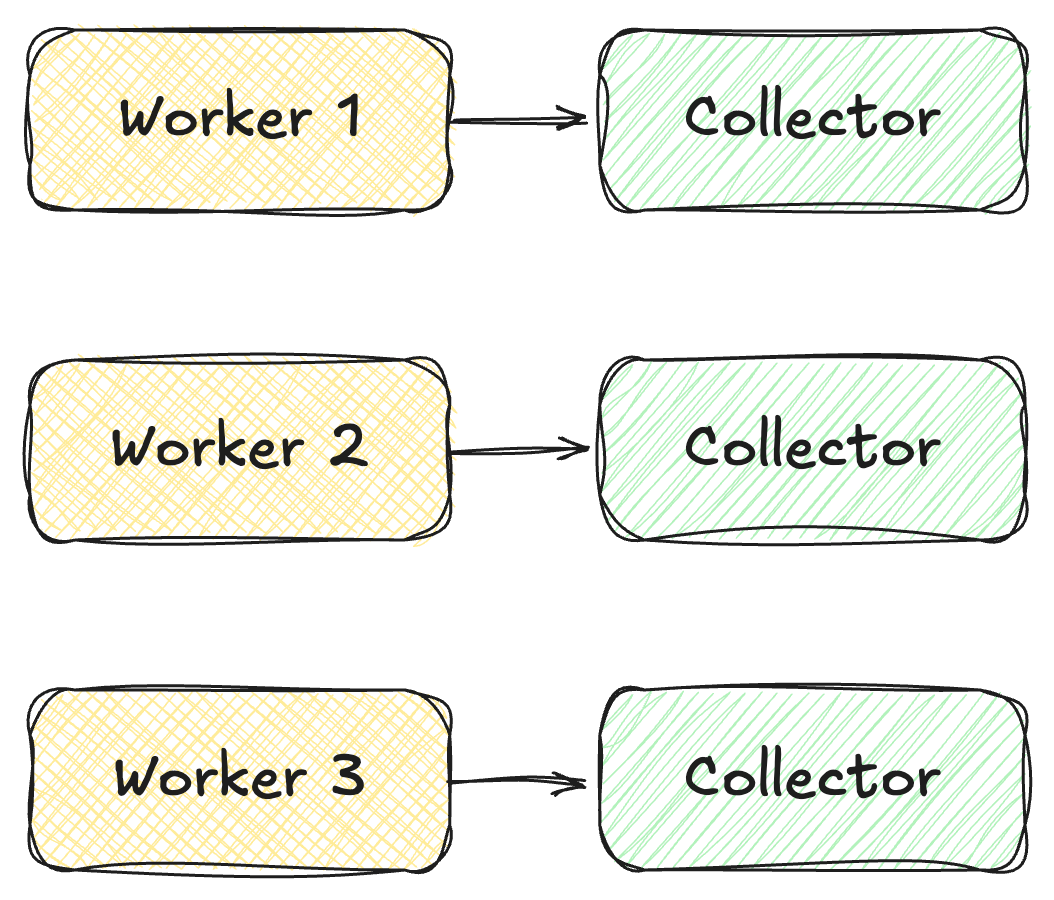
Each worker runs its own collector.
This works, but it fragments telemetry.
So v2 raises an important design question:
Should collectors remain process local, or should workers forward events to a shared pipeline?
Possible directions I can think of from here:
1. Per Worker Pipelines
Each worker exports its own telemetry.
Pros:
simplest architecture
no inter process communication
Cons:
fragmented aggregation
2. Shared Collector Process
Workers forward events to a central collector.
Possible transports:
Unix sockets
UDP
shared queues
Pros:
centralized processing
unified exporters
Cons:
increased complexity
potential bottlenecks
The likely direction would be optional shared collectors, while keeping the default architecture simple.
Should Pipelines Become Explicit?
In v1 the collector sends batches directly to sinks.
But real telemetry pipelines often require intermediate processing:
metadata enrichment
route normalization
PII redaction
sampling adjustments
So another question emerges.
Should Profilis introduce a processing stage?

Processors could add functionality without complicating exporters.
But the key constraint remains performance.
If processors become expensive, they defeat the purpose of the architecture.
So if v2 introduces processors, they must remain extremely lightweight.
Should Profilis Integrate with OpenTelemetry?
OpenTelemetry has effectively become the default observability ecosystem.
That raises another design question.
Should Profilis become a wrapper around OpenTelemetry?
Two directions are possible.
1. Native OpenTelemetry
Profilis emits spans through OpenTelemetry APIs.
Pros:
ecosystem compatibility
existing exporters
Cons:
larger runtime footprint
reduced control over performance
2. Lightweight Bridge
Profilis keeps its own pipeline but:
reads OTEL trace context
exports events via OTLP
Pros:
interoperability
minimal dependencies
The second approach seems more aligned with Profilis’ goals.
Interoperate with the ecosystem, but remain lightweight.
Should Profilis Become a Storage System?
Another question surfaced while building the UI.
Should Profilis persist telemetry data?
Possible storage engines could include:
SQLite
DuckDB
ClickHouse
That would enable powerful analysis features.
But it would also fundamentally change the scope of the project.
Profilis currently treats exporters as pluggable sinks.
This keeps the core system focused on capturing and transporting telemetry.
The likely direction for v2 is to keep Profilis as a pipeline, not a database.
Storage should remain the responsibility of exporters.
A Pattern Emerges
Looking across these decisions, a pattern starts to emerge.
Profilis consistently optimizes for three things.
Hot Path Safety
Instrumentation must remain extremely cheap.
Operational Safety
The observability system should never endanger application stability.
Architectural Simplicity
The pipeline should remain small enough to reason about.
Every potential feature is evaluated against these constraints.
Not because complexity is bad.
But because complexity in observability systems often shows up at the worst possible time, when production is already on fire.
What Comes Next
Profilis v1 proved the architecture works.
v2 is about making that architecture more predictable, operable, and extensible without sacrificing the core principle:
Observability should be cheap enough to leave on.
The next few months will likely involve experimenting with some of these ideas in the open.
Some will make it into next version. Some probably won’t.
That’s part of the process.
But till then you can checkout the latest version on github. Or try,
pip install profilisIf you have come this far, would love to hear your thoughts, ideas or suggestions on this article.
